Paul J. Sarvadi
Chairman of the Board
and Chief Executive Officer
April 20, 2021
Dear Fellow Stockholders:
On behalf of your Board of Directors and management, I am pleased to invite you to attend the Annual Meeting of Stockholders of Insperity, Inc. to be held in the Auditorium of Centre I of our corporate headquarters located at 19001 Crescent Springs Drive, Kingwood, Texas 77339, on May 22, 2019,24, 2021, at 1:30 p.m. Houston, Texas time.
Please carefully consider the information in the enclosed proxy statement regarding the proposals to be presented at the meeting. Our annual report on Form 10-K for the year ended December 31, 20182020 is also enclosed.
It is important that your shares are represented at the meeting. Whether or not you plan to attend the meeting, please submit your proxy via the Internet or telephone or by completing and returning the enclosed proxy card or voting instruction card in the envelope provided. You may also attend and vote at the meeting by following the procedures that we have described in the proxy statement.
We are monitoring the developments related to the impact of the evolving coronavirus (COVID-19) situation. As a result, we may impose additional procedures or limitations on meeting attendees or may decide to hold the meeting in a different location or solely by means of virtual communications. If we decide to modify the structure of our meeting, we will announce the decision to do so in advance, and details on how to participate will be included in a press release available in the Annual Meetings section under the Investor Relations tab on our website at www.insperity.com/annualmeeting and filed with the Securities and Exchange Commission as additional proxy materials.
Thank you for your continued support and investment in our business. We look forward to seeing you at the meeting.
Sincerely,

Paul J. Sarvadi
Chairman of the Board and Chief Executive Officer
NOTICE OF ANNUAL MEETING OF STOCKHOLDERS OF INSPERITY, INC.
Date: May 22, 201924, 2021
Time: 1:30p.m. Houston, Texas time
Place: The Auditorium in Centre I of our corporate headquarters at 19001 Crescent Springs Drive, Kingwood, Texas 77339
At the meeting, stockholders will consider and act upon the following matters:
1.To elect the three nominees named in the proxy statement to the Board of Directors;
2.To cast an advisory vote to approve executive compensation (“say-on-pay” vote); and
3.To ratify the appointment of Ernst & Young LLP as our independent registered public accounting firm for the year ending December 31, 2021.
Important Notice Regarding the Availability of Proxy Materials: A full set of all proxy materials for the Annual Meeting of Stockholders to be held on May 22, 201924, 2021 is enclosed with this Notice. Additionally, the Company’s proxy statement, most recent annual report on Form 10-K, and other proxy materials are available at www.insperity.com/annualmeeting.
Only stockholders of record at the close of business on April 2, 20195, 2021 are entitled to notice of, and to vote at, the meeting.
We are monitoring the developments related to the impact of the evolving COVID-19 situation. As a result, we may impose additional procedures or limitations on meeting attendees or may decide to hold the meeting in a different location or solely by means of virtual communications. If we decide to modify the structure of our meeting, we will announce the decision to do so in advance, and details on how to participate will be included in a press release available in the Annual Meetings section under the Investor Relations tab on our website at www.insperity.com/annualmeeting and filed with the Securities and Exchange Commission as additional proxy materials.
| It is important that your shares be represented at the Annual Meeting of Stockholders regardless of whether you plan to attend. Therefore, please submit your proxy via the Internet or telephone or by completing and returning the enclosed proxy card or voting instruction card. If you are present at the meeting, and wish to do so, you may revoke the proxy and vote in person. | ||||||||||||||
By Order of the Board of Directors

Daniel D. Herink
Senior Vice President of Legal,
General Counsel and Secretary
April 17, 201920, 2021
Kingwood, Texas
TABLE OF CONTENTS
| Outstanding Equity Awards Table at | ||||||
INSPERITY, INC.
PROXY STATEMENT
Solicitation
The accompanying proxy is solicited by the Board of Directors, or Board, of Insperity, Inc., a Delaware corporation, for use at the 20192021 Annual Meeting of Stockholders to be held on May 22, 2019,24, 2021, and at any reconvened meeting after an adjournment thereof. The 20192021 Annual Meeting of Stockholders will be held at 1:30 p.m. (Houston, Texas time), in the Auditorium in Centre I of our corporate headquarters at 19001 Crescent Springs Drive, Kingwood, Texas 77339.
We are monitoring the developments related to the impact of the evolving COVID-19 situation. As a result, we may impose additional procedures or limitations on meeting attendees or may decide to hold the meeting in a different location or solely by means of virtual communications. If we decide to modify the structure of our meeting, we will announce the decision to do so in advance, and details on how to participate will be included in a press release available in the Annual Meetings section under the Investor Relations tab on our website at www.insperity.com/annualmeeting and filed with the Securities and Exchange Commission as additional proxy materials.
Voting Information
If your name is registered on our stockholder records as the owner of the shares, then you are the “stockholder of record” and you may vote in one of four ways:
•by attending the meeting and voting at the meeting;
•via the Internet at the address listed on your proxy card; or
•by telephone using the toll-free number listed on your proxy card.
If your shares are held by a bank, broker or other custodian (commonly referred to as shares held “in street name”), the availability of telephone and Internet voting will depend on the processes of your custodian. Therefore, if your shares are held in street name, we recommend that you follow the voting instructions on the form that you receive from your custodian. If your shares are held in street name and you do not give your custodian direction on how to vote your shares, then your custodian will not have discretion to vote your shares on matters presented at the meeting, other than Proposal 3. If you hold your shares in street name through a custodian, you are invited to attend the 20192021 Annual Meeting of Stockholders, but you must obtain a signed proxy from your custodian in order to vote in person.at the meeting.
For stockholders of record, if you either return your signed proxy or submit your proxy using the Internet or telephone procedures available to you, your shares will be voted as you direct. If you properly execute and return the proxy without indicating a voting direction, then your shares will be voted FOR the election as directors of the nominees listed herein, and FOR Proposals 2 and 3. In addition, the proxy confers discretionary authority to the persons named in the proxy authorizing those persons to vote, in their discretion, on any other matters properly presented at the 20192021 Annual Meeting of Stockholders. The Board is not currently aware of any such other matters.
If you are a stockholder of record, you may change or revoke your vote by timely: (1) submitting written notice of revocation to the Secretary of the Company at the address for our corporate headquarters, provided above; (2) submitting another proxy card that is properly signed and later dated; (3) submitting a proxy again on the Internet or by telephone; or (4) voting in person at the 20192021 Annual Meeting of Stockholders. If you hold your shares in street name, you may change or revoke your vote by timely (1) submitting new instructions in the manner provided by your custodian or (2) contacting your custodian to obtain a proxy to vote in person at the meeting.
We pay the expense of preparing, printing and mailing proxy materials to our stockholders. In addition to solicitation by mail, our officers or employees (none of whom will receive additional compensation) may solicit the return of proxies by telephone, email or personal interview. We will also reimburse brokerage houses and other nominees for their reasonable expenses in forwarding proxy materials to beneficial owners of our common stock.
| Insperity | 1 | 2021 Proxy Statement | ||||||
The approximate date on which this proxy statement and the accompanying proxy card will first be sent to stockholders is April 17, 2019.20, 2021.
At the close of business on April 2, 2019,5, 2021, the record date for the determination of stockholders entitled to receive notice of, and to vote at, the 20192021 Annual Meeting of Stockholders or any reconvened meeting after an adjournment thereof, 41,256,85838,674,991 shares of our common stock, par value $0.01 per share, were outstanding. Each share of our common stock is entitled to one vote upon each of the matters to be voted on at the 20192021 Annual Meeting of Stockholders. The presence, in person or by proxy, of a majority of the outstanding shares of our common stock is
required for a quorum. If a quorum is present at the meeting, under our Bylaws, action on a matter or to elect director nominees shall be approved if the votes cast in favor of the matter or nominee exceed the votes cast opposing the matter or such nominee, as applicable.
In determining the number of votes cast, shares abstaining from voting or not voted on a matter will not be treated as votes cast. Accordingly, although proxies containing broker non-votes (which result when a broker holding shares for a beneficial owner has not received timely voting instructions on certain matters from such beneficial owner and when the broker does not otherwise have discretionary power to vote on a particular matter) are considered “shares present” in determining whether there is a quorum present at the 20192021 Annual Meeting of Stockholders, they are not treated as votes cast with respect to the election of directors, and thus will not affect the outcome of the voting on the election of directors or any of the other proposals on non-routine matters to be voted on at the 20192021 Annual Meeting of Stockholders.
SECURITY OWNERSHIP
The following table sets forth the number and the percentage of shares of our common stock that were beneficially owned as of April 2, 20195, 2021 by: (1) each person known by us to beneficially own 5% or more of our common stock; (2) all current directors and persons nominated to become directors; (3) each of our executive officers identified in the Summary Compensation Table; and (4) all of our directors, director nominees and executive officers as a group.
| Name of Beneficial Owner | Amount and Nature of Beneficial Ownership1 | Percent of Class | ||||||||||||||||||
| Timothy T. Clifford | 13,028 | * | ||||||||||||||||||
| Eli Jones | 722 | * | ||||||||||||||||||
| Carol R. Kaufman | 32,146 | * | ||||||||||||||||||
| John L. Lumelleau | 4,199 | * | ||||||||||||||||||
| Ellen H. Masterson | 7,714 | 2 | * | |||||||||||||||||
| Randall Mehl | 10,786 | * | ||||||||||||||||||
| John M. Morphy | 6,940 | * | ||||||||||||||||||
| Latha Ramchand | 4,199 | * | ||||||||||||||||||
| Richard G. Rawson | 456,216 | 3 | 1.18 | % | ||||||||||||||||
| Paul J. Sarvadi | 1,688,483 | 4 | 4.37 | % | ||||||||||||||||
| A. Steve Arizpe | 195,268 | 5 | * | |||||||||||||||||
| Daniel D. Herink | 41,577 | * | ||||||||||||||||||
| Jay E. Mincks | 108,779 | * | ||||||||||||||||||
| Douglas S. Sharp | 32,829 | * | ||||||||||||||||||
| BlackRock, Inc. | 4,296,824 | 6 | 11.11 | % | ||||||||||||||||
| FMR LLC | 2,355,666 | 7 | 6.09 | % | ||||||||||||||||
| Mawer Investment Management Ltd. | 2,155,957 | 8 | 5.57 | % | ||||||||||||||||
| The Vanguard Group | 3,336,596 | 9 | 8.63 | % | ||||||||||||||||
| Executive Officers and Directors as a Group (15 Persons) | 2,667,497 | 6.90 | % | |||||||||||||||||
| Name of Beneficial Owner | Amount and Nature of Beneficial Ownership1 | Percent of Class | ||||||
| Timothy T. Clifford | 6,006 | * | ||||||
| Carol R. Kaufman | 27,624 | * | ||||||
| Ellen H. Masterson | 3,092 | * | ||||||
| Randall Mehl | 4,264 | 2 | * | |||||
| John M. Morphy | 3,718 | * | ||||||
| Richard G. Rawson | 522,518 | 3 | 1.27 | % | ||||
| Paul J. Sarvadi | 1,893,062 | 4 | 4.59 | % | ||||
| Austin P. Young | 38,954 | * | ||||||
| A. Steve Arizpe | 160,441 | 5 | * | |||||
| Daniel D. Herink | 30,873 | * | ||||||
| Jay E. Mincks | 69,085 | * | ||||||
| Douglas S. Sharp | 30,785 | * | ||||||
| BlackRock Fund Advisors | 6,068,545 | 6 | 14.71 | % | ||||
| The Vanguard Group, Inc. | 4,122,712 | 7 | 9.99 | % | ||||
| Executive Officers and Directors as a Group (13 Persons) | 2,831,714 | 6.86 | % | |||||
* Represents less than 1%.
| 2021 Proxy Statement | ||||||||
As of April 5, 2021, none of these individuals held options exercisable for shares of our common stock. The number of shares of our common stock beneficially owned by each person includes options exercisable on April 2, 2019, or within 60 days after April 2, 2019, and unvested shares of restricted stock and unvested restricted stock units as of April 2, 2019.5, 2021. Each owner of restricted stock has the right to vote his or her shares but may not transfer them until they have vested.
| Name of Beneficial Owner | Unvested Restricted Stock | ||||||||||||
| and Restricted Stock Units | |||||||||||||
| Timothy T. Clifford | — | ||||||||||||
| Eli Jones | — | ||||||||||||
| Carol R. Kaufman | — | ||||||||||||
John Lumelleau | — | ||||||||||||
| Ellen H. Masterson | |||||||||||||
| Randall Mehl | — | ||||||||||||
| John M. Morphy | — | ||||||||||||
| Latha Ramchand | — | ||||||||||||
| Richard G. Rawson | — | ||||||||||||
| A. Steve Arizpe | 19,624 | ||||||||||||
| Daniel D. Herink | 12,104 | ||||||||||||
| Jay E. Mincks | 26,008 | ||||||||||||
| Paul J. Sarvadi | 42,679 | ||||||||||||
| Douglas S. Sharp | 15,344 | ||||||||||||
2 Includes 100 shares owned by Conrad J. Masterson Jr. (spouse). 3Includes 184,950 shares owned by the RDKB Rawson LP, 179,316 shares owned by the R&D Rawson LP, 91,250 owned by the DMR Spousal Lifetime Trust and 700 shares owned by Dawn M. Rawson (spouse). Mr. Rawson shares voting and investment power over all such shares with his wife, except for 700 shares owned by his wife. 4 Includes 999,612 shares owned by Our Ship Limited Partnership, Ltd. and 33,520 shares owned by Paul J. Sarvadi and Vicki D. Sarvadi (spouse). Mr. Sarvadi shares voting and investment power over all such shares with his spouse. Also includes shares pledged to banks as collateral for loans. The Board determined the amount of shares pledged by Mr. Sarvadi was insignificant under our pledging policy. See “Corporate Governance — Prohibition on Hedging and Pledging of Our Common Stock” for a further discussion. 5 Includes 109,808 shares owned by S.C.A Legacy, Ltd. 6 Based on a Schedule 13G/A filed with the U.S. Securities and Exchange Commission (“SEC”) on January 27, 2021. BlackRock, Inc. reported sole voting power with respect to 4,204,784 shares and sole dispositive power with respect to 4,296,824 shares. The address of BlackRock, Inc. is 55 East 52nd Street, New York, New York 10055. 7 Based on a Schedule 13G/A filed with the SEC on February 8, 2021. FMR LLC reported sole voting power with respect to 674,002 shares and sole dispositive power with respect to 2,355,666 shares. The address of FMR LLC is 245 Summer Street, Boston, Massachusetts 02210. 8 Based on a Schedule 13G/A filed with the SEC on February 5, 2021. Mawer Investment Management Ltd. reported sole voting power with respect to 2,155,957 shares and sole dispositive power with respect to 2,155,957 shares. The address of Mawer Investment Management Ltd. is 600, 517 - 10th Avenue SW, Calgary, Alberta, Canada T2R 0A8. 9 Based on a Schedule 13G/A filed with the SEC on February 10, 2021. The Vanguard Group reported shared voting power with respect to 59,544 shares, sole dispositive power with respect to 3,248,397 shares and shared dispositive power with respect to 88,199 shares with Vanguard Fiduciary Trust Company. The address of the Vanguard Group is 100 Vanguard Blvd., Malvern, Pennsylvania 19355. |
Insperity | 3 | 2021 Proxy Statement | |||||||
PROPOSAL NUMBER 1:
ELECTION OF DIRECTORS
General
In accordance with our Certificate of Incorporation, the members of the Board are divided into three classes. Our Certificate of Incorporation also provides that such classes shall be as nearly equal in number as possible. The terms of office of the Class I, Class II and Class III directors expire at the Annual Meeting of Stockholders in 2020,2023, 2021 and 2019,2022, respectively. The term of office of each of Randall Mehl,Carol. R. Kaufman, John M. MorphyL. Lumelleau and Richard G. Rawson,Paul J. Sarvadi, who comprise the current Class IIIII directors, expires at the time of the 20192021 Annual Meeting of Stockholders, or as soon thereafter as their successors (if any) are elected and qualified. All nominees have consented to be named in this proxy statement and to serve as a director if elected.
Our Certificate of Incorporation and Bylaws provide that the number of directors on the Board shall be fixed from time to time by the Board but shall not be less than three nor more than 15 persons. The number of members constituting the Board is currently fixed at eight.ten.
Voting; Approval Requirements
All proxies will be voted in favor of the nominees named below unless a stockholder has indicated otherwise. The affirmative vote of a majority of the votes cast by holders of our common stock present in person or by proxy at the 20192021 Annual Meeting of Stockholders is required for election of the nominees. Abstentions and broker non-votes will be deemed votes not cast. Under our Bylaws and in accordance with Delaware law, a director’s term extends until his or her successor is duly elected and qualified, or until he or she resigns or is removed from office. Thus, an incumbent director who fails to receive the required vote for re-election at our Annual Meeting of Stockholders would continue serving as a director (sometimes referred to as a “holdover director”), generally until the next Annual Meeting of Stockholders. However, as a condition to being nominated to continue to serve as a director, theeach incumbent director nominees havenominee has submitted an irrevocable letter of resignation that is effective upon and only in the event that (1) such nomineehe or she fails to receive the required vote; and (2) the Board accepts such resignation. In such an event, the Nominating and Corporate Governance Committee is required to make a recommendation to the Board as to whether the Board should accept the resignation, and the Board is required to decide whether to accept the resignation and to disclose its decision-making process within 90 days from the certification of the election results.
If, at the time of or prior to the 20192021 Annual Meeting of Stockholders, any of the nomineesnominee should be unable or decline to serve, the discretionary authority provided in the proxy may be used to vote for a substitute or substitutes designated by the Board. The Board has no reason to believe that any substitute nominee or nominees will be required. No proxy will be voted for a greater number of persons than the number of nominees named herein.
Nominees for Director
The following individuals have been nominated for re-election to the Board as Class IIIII directors with terms expiring at the 20222024 Annual Meeting of Stockholders:
 | Carol R. Kaufman | ||||
Ms. Kaufman, age 71, joined the Company as a director in November 2013. From July 2011 through April 2018, Ms. Kaufman served as the executive vice president, secretary, chief administrative officer and chief governance officer of The Cooper Companies, Inc. (NYSE: COO), a global medical device company, where she had previously served in a variety of capacities since October 1995, including as vice president of legal affairs beginning in March 1996 and senior vice president beginning in October 2004. From January 1989 through September 1995, she served as vice president, secretary and chief administrative officer of Cooper Development Company, a former affiliate of The Cooper Companies, Inc. Beginning in 1971, Ms. Kaufman held several financial positions, including deputy corporate controller, with Cooper Laboratories, Inc., the former parent of The Cooper Companies, Inc. Ms. Kaufman has served on the University Advisory
| Insperity | 4 | 2021 Proxy Statement | ||||||
Council and the International Advisory Board for Boston University since March 2019 and the board of trustees for the University of St. Andrews American Foundation since September 2019. Ms. Kaufman served as a director of Chindex, Inc. (former Nasdaq-listed company) from November 2000 until September 2014, serving on its audit and compensation committees and as chair of its governance and nominating committee, and as a member of its special transaction committee until its sale in 2014 to TPG. Ms. Kaufman earned a Bachelor of Science degree in Mathematics in 1971 from Boston University.
Ms. Kaufman brings extensive financial, accounting and business experience, including in corporate governance, risk management, executive compensation and employee benefits to the Board. Her varied roles within The Cooper Companies, Inc. provide the Board with additional expertise on accounting and controls, and on evaluating and executing strategic initiatives.
 | John L. Lumelleau | ||||
Mr. Lumelleau, age 69, joined the Company as a director in December 2019. Mr. Lumelleau served as the president and chief executive officer of Lockton, Inc., the largest privately held independent insurance broker and a top 10 insurance broker globally, from 2002 until his retirement in 2017. Since his retirement, he has served as an independent advisor to Lockton and continues to serve on the board of directors of Lockton. In 2019, he also became chairman of the board of Orchid Underwriters Agency, LLC, a leading specialty underwriter of catastrophe exposed property insurance, and is a member of the management advisory board of TowerBrook Capital Partners. While he served as president and chief executive officer, Lockton’s revenues grew from $92 million to $1.4 billion and it expanded from 7 offices to 85 offices globally. Previously, he served as president of Lockton from 2000 to 2002 and as operations executive from 1997 to 1999. Prior to joining Lockton, Mr. Lumelleau held various roles at Alexander & Alexander, Inc. and its successor, AON Risk Services, from 1976 until 1997, including executive vice president of global retail sales. He currently serves on the board of trustees of Fordham University and the Board of Overseers of the St. John’s University School of Risk Management & Actuarial Sciences, and he previously served on the board of directors of The Council of Insurance Agents and Brokers. Mr. Lumelleau holds a Bachelor of Arts from Fordham University. Mr. Lumelleau brings substantial leadership, industry and business experience to the Board, including an extensive knowledge of the insurance industry.
Mr. Lumuelleau’s previous experience as the long-time CEO of the world’s largest privately held insurance brokerage firm provides the Board with substantial knowledge, insight and key perspectives related to risk management and the opportunities and challenges faced by growth-oriented organizations.
 | Paul J. Sarvadi | ||||
Mr. Sarvadi, age 64, chairman of the board and chief executive officer and co-founder of the Company and its subsidiaries, has been a director since the Company’s inception in 1986. He has also served as the Chairman of the Board and Chief Executive Officer of the Company since 1989 and as president of the Company from 1989 to August 2003. He attended Rice University and the University of Houston prior to starting and operating several small companies. Mr. Sarvadi has served as president of the National Association of Professional Employer Organizations (“NAPEO”) and was a member of its board of directors for five years. In 2001, Mr. Sarvadi was selected as the 2001 National Ernst & Young Entrepreneur of the Year ® for service industries. In 2004, he received the Conn Family Distinguished New Venture Leader Award from Mays Business School at Texas A&M University. In 2007, he was inducted into the Texas Business Hall of Fame.
Mr. Sarvadi brings substantial business and operational experience to the Board, including an extensive knowledge of sales, customer relationships, and issues affecting small to medium-sized businesses. Mr. Sarvadi’s role as
| Insperity | 5 | 2021 Proxy Statement | ||||||
a co-founder of the Company and lengthy service as chief executive officer of the Company provide to the Board extensive knowledge and insight of our operations and issues affecting the Company as well as the broader PEO industry. Mr. Sarvadi’s previous experience starting and operating several small businesses, as well as his frequent interaction with the Company’s clients, provide valuable insight to the challenges facing small to medium-sized businesses, which is a principal focus of the Company.
| The Board recommends that stockholders vote “For” all of the nominees listed above, and proxies executed and returned will be so voted unless contrary instructions are indicated thereon. | ||
Directors Not Currently Subject to Election
The following directors are not subject to election at the 2021 Annual Meeting of Stockholders:
Class III Directors (Term Expires at 2022 Annual Meeting of Stockholders)
 | Randall Mehl | ||||
Mr. Mehl, age 51,53, joined the BoardCompany as a director in December 2017. Mr. Mehl has served on the boards of ICF (Nasdaq: ICFI), a global consulting and technology services provider since September 2017, and Kforce Inc. (Nasdaq: KFRC), a professional staffing firm since January 2017. Mr. Mehl is the president of Stewardship Capital Advisors, LLC, which manages an equity fund focused on making investments in business and technology services. Previously, he served as a managing director and a partner with Baird Capital, a middle market private equity group, and led a team focused on the business and technology services sector from 2005 until the end of 2016. From 1996 to 2005, Mr. Mehl was a senior equity research analyst with Robert W. Baird & Company, covering various areas within the broader business and technology services sector, including professional employer organizations. Mr. Mehl serves and has previously served on several private company boards and on the investment committee for several funds, and has expertise analyzing, acquiring and selling businesses.
Mr. Mehl brings extensive experience in the technology and business process outsourcing sectors, including professional employer organizations (“PEOs”), which are directly relevant to our company’s objectives. His background as an investor, adviser and board member focused on these industries provides an important investor perspective to our Board and provides key insight to the Board as it analyzes our long-term objectives.
 | |||||
| Insperity | 6 | 2021 Proxy Statement | ||||||
certificate in 1973. Mr. Morphy was originally appointed to the Board pursuant to a prior agreement with a former significant stockholder.
Mr. Morphy brings extensive financial, accounting and industry experience to the Board. His more than 20 years of financial leadership experience for various public corporations and experience in many facets of finance within varied environments, including rapid growth companies, global Fortune 500 industrial companies and major accounting firms, provide substantial knowledge and insight that are valuable to the Board.
 | Richard G. Rawson | ||||
Mr. Rawson, age 70,72, has been a director of the Company since 1989. In May 2018, Mr. Rawson retired from his position as president of the Company, a position that he had held since August 2003. Before being elected president, he served as executive vice president of administration, chief financial officer and treasurer of the Company from February 1997 until August 2003. Prior to that, he served as senior vice president, chief financial officer and treasurer of the Company since 1989. Prior to joining the Company in 1989, Mr. Rawson served as a senior financial officer and controller for several companies in the manufacturing and seismic data processing industries. He is the past president of National Association of Professional Employer Organizations (“NAPEO”).NAPEO. Mr. Rawson currently serves on the Executive Advisory Committee of the Bauer College Board of the C.T. Bauer College of Business at the University of Houston, the Board of Visitors at the University of Houston and the National Board of Directors for Genesys Works. Additionally, he is co-founder and chairman of Infinity Learning Solutions and co-founder and partner of Trinity Legacy Partners, a registered investment advisory firm. Mr. Rawson has a Bachelor of Business Administration degree in Finance from the University of Houston.Houston and received a Doctor of Humane Letters (honorary) from the University of Houston in December 2020.
Mr. Rawson brings financial and operational experience to the Board. His lengthy service as president of the Company, as well as his prior service as chief financial officer and treasurer of the Company, provide in-depth knowledge and insight of Company operations and financial matters to the Board.
 | Eli Jones | ||||
Dr. Eli Jones, age 59, rejoined the Company as a Class III director in December 2020. Since July 2015, Dr. Jones has served as the Dean of the Mays Business School at Texas A&M University. He has also served on the board of trustees of the Invesco family of funds since 2016, and as an audit committee member since 2020. Dr. Jones was also a director of Insperity from 2004 through June 2016. Prior to his current position at the Mays Business School, from 2012, he was the Dean of the Sam M. Walton College of Business at the University of Arkansas and holder of the Sam M. Walton Leadership Chair in Business. Prior to joining the faculty at the University of Arkansas, he was Dean of the E.J. Ourso College of Business and Ourso Distinguished Professor of Business at Louisiana State University (LSU) from 2008 to 2012; Professor of Marketing and Associate Dean at the C.T. Bauer College of Business at the University of Houston from 2007 to 2008; an Associate Professor of Marketing from 2002 to 2007; and an assistant professor from 1997 until 2002. He taught at Texas A&M University for several years before joining the faculty of the University of Houston. Dr. Jones served as the executive director of the Program for Excellence in Selling and the founding director of the Sales Excellence Institute at the University of Houston from 1997 to 2007. Before becoming a professor, he worked in sales and sales management for three Fortune 100 companies: Quaker Oats, Nabisco and Frito-Lay. He received his Bachelor of Science degree in Journalism in 1982, his MBA in 1986, and his Ph.D. in 1997, all from Texas A&M University.
Dr. Jones brings to the Board significant experience and cutting-edge knowledge and expertise. He is considered a “sales scientist” in that he conducts and publishes cutting-edge research in sales, sales management, marketing strategy, leadership and customer relationship management based on data from organizations world-wide, which are areas critical to the Company. Dr. Jones is able to draw upon his research to provide the Board knowledge with respect to
| 7 | 2021 Proxy Statement | |||||||
Class I Directors (Term Expires at 20202023 Annual Meeting of Stockholders)
 | Timothy T. Clifford | ||||
Mr. Clifford, age 63,65, joined the Board as a director in October 2016.2016 and he currently serves as the Company’s lead independent director. Mr. Clifford has served as an operating partner and consultant since September 2019 to Welsh, Carson, Anderson and Stowe, a private equity firm focused on investments in the technology and healthcare industries. From June 2015 through March 2019, Mr. Clifford served as president and chief executive officer of Frontline Education, a private-equity-backed cloud software company that manages human resources functions at over 80,000 public and private schools in North America. He is also a co-founder of the Frontline Research and Learning Institute, as well as The Line, a publication sharing new ideas and insight while encouraging civil discourse on the most challenging problems facing K-12 educators and administrators. Prior to joining Frontline Education, from 2010 through 2013, Mr. Clifford was a corporate officer and co-president of Automatic Data Processing (NYSE: ADP) National Accounts, a $2.5 billion human capital management software and services business serving the largest U.S. companies, and was the co-founder and chief executive officer of Workscape, Inc., a pioneering cloud software provider to the human capital management industry, from 1999 until its acquisition by ADP in 2010. Prior to founding Workscape, he held executive or senior leadership positions at HealthPlan Services, Consolidated Group and Prudential Insurance Company. From 2013 to 2015, he also served as a director and audit committee member of Carbonite Inc. (Nasdaq: CARB). Mr. Clifford holds a Bachelor of Liberal Arts degree from Northeastern University in Boston.
Mr. Clifford brings extensive technology, entrepreneurial and leadership experience to the Board. His substantial experience with providing HR-related services to businesses, along with his entrepreneurial background and knowledge of cloud-based software solutions for the HR services industry, provide key perspectives to the Board on matters that directly impact our business and the businesses of our customers.
 | Ellen H. Masterson | ||||
Ms. Masterson, age 68,70, joined the Company as a director in September 2017. Since 2014, Ms. Masterson has served as an independent director of Westwood Holdings Group (NYSE: WHG), an investment management firm with over $20$10 billion in assets under management, and Westwood Trust, a Texas state-chartered trust company. Ms. Masterson is the chair of the audit committee of both WHG and Westwood Trust and serves as a member of the WHG governance committee.and compensation committees. She joined the Board of Governors of The Doctors Company, a leading physician-owned medical malpractice insurer, in 2018 where she serves on the audit and finance committees. Ms. Masterson retired as a partner with PricewaterhouseCoopers LLP ("PwC") in 2008, having served in this capacity since 1999 and from 1985 to 1997. At PwC, Ms. Masterson specialized in audits of companies involved in several sectors of the financial services industry and public companies with a focus on mergers and acquisitions. She held senior positions within the leadership of PwC from 2001 to 2008, including international responsibilities across the global network of PwC firms. From 1997 to 1999, Ms. Masterson served as senior vice president and chief financial officer of American General Corporation, prior to its acquisition by American International Group, Inc. Since 1982, she has served on numerous boards of non-profit and charitable organizations.
| Insperity | 8 | 2021 Proxy Statement | ||||||
Ms. Masterson brings extensive knowledge of financial reporting and accounting issues faced by companies in the business services industry, as well as experience with strategic planning and corporate governance. With her experience as a partner in an international accounting firm, as a chief financial officer for a public company, and as an audit committee member of a public company board, Ms. Masterson strengthens the Board’s financial reporting and accounting acumen, and provides significant expertise from which she can draw to advise and consult with the Board and management on these critical matters impacting our organization.financial and audit-related matters.
 | Latha Ramchand | ||||
Dr. Ramchand, age 78,60, joined the Company as a director in January 2003 and he is the Company’s lead independent director. Mr. YoungDecember 2019. Dr. Ramchand has served as senior vice president, chief financial officerExecutive Vice Chancellor and treasurerProvost at the University of CellStar Corporation from 1999 to December 2001, when he retired. From 1996 to 1999, heMissouri since her appointment in August 2018. Previously, Dr. Ramchand served as executive vice president - finance and administration of Metamor Worldwide, Inc. Mr. Young also held the position of senior vice president and chief financial officer of American General Corporation for over eight years and was a partner in the Houston and New York offices of KPMG LLP before joining American General. Mr. Young served as a director of Amerisafe, Inc. (Nasdaq: AMSF) from November 2005 until June 2017, where he also served as chairdean of the audit committee and as a memberC.T. Bauer College of the nominating and corporate governance, and risk committees. He served as a director and chairBusiness of the audit committee of Tower Group International, Ltd. (former Nasdaq-listed company) and its predecessor company from 2004 until September 2014. He is a member of the Houston and State Chapters of the Texas Society of CPAs, the American Institute of CPAs, and the Financial Executives International. He holds an accounting degree from The University of Texas.
Summary of Committee Memberships
The following table summarizes the committees of which each director is currently a member:
| Compensation Committee | Clifford (Chair) Jones Kaufman Mehl | |||||
| Finance, Risk Management and Audit Committee | Lumelleau Morphy Ramchand | |||||
| Nominating and Corporate Governance Committee | Kaufman (Chair) Clifford | |||||
CORPORATE GOVERNANCE
Corporate Governance Guidelines
We have adopted Corporate Governance Guidelines, which include guidelines for, among other things, director responsibilities, qualifications and independence. The Board regularly monitors developments in corporate governance practices and regulatory changes and periodically assesses the adequacy of and modifies our Corporate Governance Guidelines and committee charters as warranted in light of such developments. You can access our Corporate Governance Guidelines in their entirety on our website at www.insperity.com in the Corporate Governance section under the Investor Relations tab. The information on our website is not, and shall not be deemed to be, a part of this proxy statement.
| Insperity | 9 | 2021 Proxy Statement | ||||||
On an annual basis, each director and named executive officer is obligated to complete a questionnaire that requires disclosure of any transactions with the Company in which the director or executive officer, or any member of his or her immediate family, has a direct or indirect material interest. Directors are also required to promptly advise us of any changes to the information previously provided.
Director Independence
Under the rules of the NYSE, a majority of our directors must be independent. No director qualifies as independent unless the Board affirmatively determines that the director has no material relationship with the Company (either directly or as a partner, stockholder or officer of an organization that has a relationship with the Company). In
evaluating each director’s independence, the Board considered all relevant facts and circumstances, and relationships and transactions between each director, her or his family members or any business, charity or other entity in which the director has an interest or a significant relationship on the one hand, and the Company, its affiliates, or our senior management on the other. As a result of this review, at its meeting held onin February 26, 2019,2021, the Board affirmatively determined that all of the Company’s directors are independent, with the exception of Mr. Sarvadi, who is a member of our senior management, and Mr. Rawson, who was a member of our senior management until his retirement in May 2018.
The Board has considered what types of disclosure should be made relating to the process of determining director independence. To assist the Board in making disclosures regarding its determinations of independence, the Board has adopted categorical standards as contemplated under the listing standards of the NYSE then in effect. Under the rules then in effect, relationships that were within the categorical standards were not required to be disclosed and their impact on independence was not required to be separately discussed, although the categorical standards, by themselves, did not determine the independence of a particular director. The Board considers all relevant facts and circumstances in determining whether a director is independent. A relationship satisfies the categorical standards adopted by the Board if it:
•is not a relationship that would preclude a determination of independence under Section 303A.02(b) of the NYSE Listed Company Manual;
•is not required to be, and it is not otherwise, disclosed in this proxy statement.
In the course of the Board’s determination regarding the independence of directors other than Messrs. Sarvadi and Rawson, it considered all transactions, relationships and arrangements in which such directors and the Company were participants.participants or deemed to have an interest.
Selection of Nominees for the Board of Directors
Identification and Evaluation of Candidates for Nomination to the Board of Directors
The Nominating and Corporate Governance Committee may solicit ideas for potential candidates for membership on the Board from a number of sources, including members of the Board, our executive officers, individuals personally known to the members of the Board, research, and search firms. The Nominating and Corporate Governance Committee has authority to select and compensate a third-party executive search firm to help identify candidates, as it deems advisable. In addition, the Nominating and Corporate Governance Committee will consider candidates for the Board submitted by stockholders. Any such submissions should include the candidate’s name and qualifications for Board membership and should be directed to our Corporate Secretary at 19001 Crescent Springs Drive, Kingwood, Texas 77339. Although the Nominating and Corporate Governance Committee does not require the stockholder to submit any particular information regarding the qualifications of the stockholder’s candidate, the level of consideration that the Nominating and Corporate Governance Committee will give to the stockholder’s candidate will be commensurate with the quality and quantity of information about the candidate that the stockholder makes available to the Nominating and Corporate Governance Committee. The Nominating and Corporate Governance Committee will evaluate all candidates identified through the processes described above on the same basis.
In assessing a director candidate, the Nominating and Corporate Governance Committee considers the appropriate balance of experiences, skills and other qualifications required for service on the Board. See “—Director Qualifications” below for detailed information concerning directors’ qualifications. Additionally, the Nominating and Corporate Governance Committee also considers the extent to which a director candidate contributes to the diversity of
| Insperity | 10 | 2021 Proxy Statement | ||||||
the Board, with diversity being construed broadly to encompass a director candidate’s perspectives, opinions, experiences, background and other personal factors, including gender, race, ethnicity, and age. Generally, based on this initial evaluation, the chairperson of the Nominating and Corporate Governance Committee will determine whether to interview the candidate and, if warranted, will recommend that one or more members of the Nominating and Corporate Governance Committee, other members of the Board, and senior management, as appropriate, interview the candidate in person or by telephone.candidate. After completing this evaluation and interview process, the Nominating and Corporate Governance Committee makes a recommendation to the entire Board as to the persons who should be nominated by the Board, and the Board determines the nominees after considering the recommendation of the Nominating and Corporate Governance Committee.
In addition, our Bylaws permit our stockholders to nominate individuals for election as directors at our annual stockholders meeting whether or not such nominee is submitted to and evaluated by the Nominating and Corporate Governance Committee. To nominate an individual for election as a director using this process, a stockholder must follow
the procedures described under “Additional Information— Stockholder Director Nominations and Proposals for 20202022 Annual Meeting of Stockholders.”
Director Qualifications
The following are core criteria that are expected of each director or nominee:
•independence of thought and judgment;
•high integrity and ethical standards;
•the ability to dedicate sufficient time, energy and attention to the performance of her or his duties, taking into consideration any service on other public company boards; and
•skills and expertise that are complementary to the existing Board members’ skills.
In addition to these core criteria, the Nominating and Corporate Governance Committee regularly assesses the areas of expertise that will promote an effective and high-functioning board and recognizesalso considers other qualities that the Boardit may deem to be desirable, such as demonstrated business judgment, collaborative abilities, training and education, and relationships. Although a collective group should have expertise in certain substantive areas, including strategic planning, risk management, corporate governance, executive or senior leadership, service on boards of directors, financial literacy, finance and investment (including capital markets and capital management), relevant industries, sales and marketing, technology and business processes, insurance services, regulatory matters, and government relations. Certain directors or director nominees may possess expertise in the designated areas; however, agiven director or director nominee need not individually possess the experience, skill or other requisite qualification in all areas.areas, the Nominating and Corporate Governance Committee believes that the Board, as a collective group, should have experience in such areas of expertise. The Nominating and Corporate Governance Committee regularly conducts assessments of the areas of expertise possessed by the current members of the Board and the collective Board, which is considered when developing the desired profile in candidate searches.
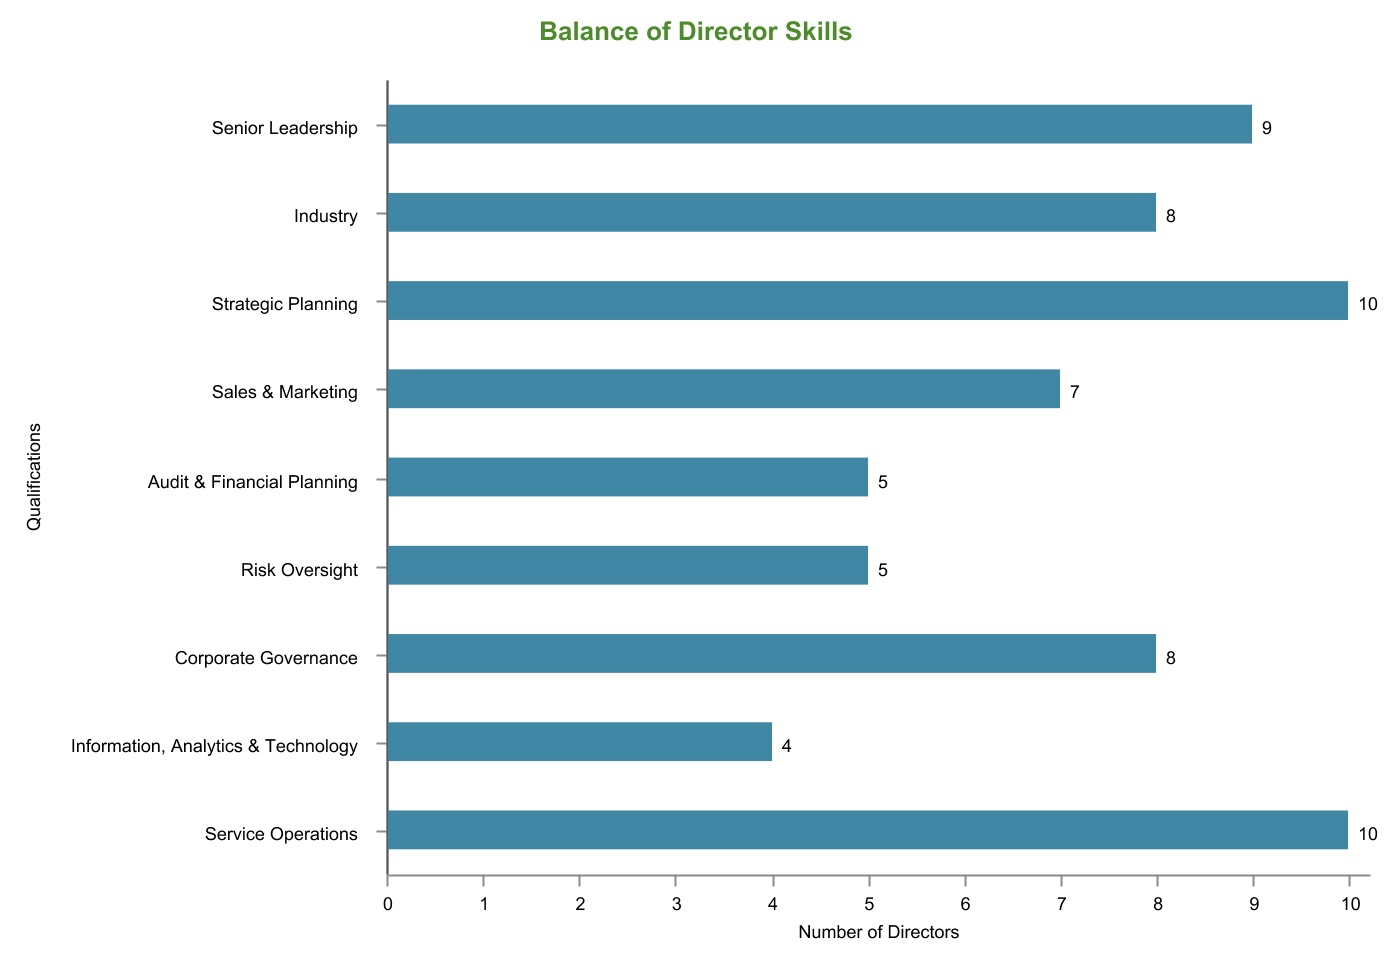
The following are the qualifications, skills, and expertise that the Nominating and Corporate Governance Committee considers critical to the Board’s ability to provide effective oversight of the Company and are directly relevant to our business, strategy and operations. The chart that follows illustrates how these qualifications and skills are distributed among our directors and nominees as a collective group. .
•Senior Leadership experience as a CEO or as another senior officer demonstrates leadership ability, as well as a practical understanding of complex organizations, processes, corporate culture and the methods to drive change and growth.
•Industry experience in human capital management, human resources, insurance services, small businesses or entrepreneurial ventures provides a valuable perspective on the Company’s business strategy, operations, key performance metrics, risks, target markets, competition and other issues specific to the Company’s business.
•Strategic Planning experience with significant corporate initiatives is valuable in assessing specific plans to capitalize on identified growth opportunities and evaluating the Company’s capital structure and capital allocation.
•Sales & Marketing experience is critical to assisting the Board with oversight of matters relating to a large sales organization, brand development, marketing to businesses and digital marketing.
| Insperity | 11 | 2021 Proxy Statement | ||||||
•Audit & Financial Planning experience is key to providing oversight to the Company’s internal controls and financial reporting and to critically evaluating metrics that measure our performance.
•Risk Oversight experience contributes to identification, assessment and prioritization of significant risks facing the Company and facilitates the Board’s role in providing oversight of the Company’s policies and procedures that are designed to manage those risks.
•Corporate Governance experience is important to the Board’s understanding of best practices in corporate governance matters and enhancing board effectiveness, and supports the Board’s goals of accountability, transparency and protection of stockholder interests.
•Information, Analytics & Technology experience assists the Board with understanding and oversight of cloud-based, mission-critical solutions, as well as cybersecurity and data privacy matters.
•Service Operations experience is valuable in understanding the issues related to a large service organization that offers business process outsourcing solutions to its clients.
We provide additional information about the qualifications, skills, and expertise of each director in the biographies for the individual directors under “—Nominees for Director” and “—Directors Not Currently Subject to Election” above.
Board of DirectorsDirectors’ Leadership
We do not have a policy with respect to whether the positions of Chairman of the Board and chief executive officer (“CEO”) should be held by the same person or two separate individuals, and believe that it is in the best interest of the Company to consider that question from time to time in the context of succession planning. At this time, the Board believes that it is in the best interest of the Company, and is an appropriate leadership structure, to have the CEO also serve as Chairman of the Board. Combining the CEO and Chairman of the Board roles provides an efficient and effective leadership model that promotes unambiguous accountability and alignment on corporate strategy. Mr. Sarvadi co-founded the Company in 1986 and has served as Chairman of the Board and CEO since 1989. The Board believes that Mr. Sarvadi’s intimate knowledge of the daily operations of, and familiarity with, the Company and industry put him in the best position to provide leadership to the Board on setting the agenda, emerging issues facing the Company and the PEO industry, and strategic opportunities. Additionally, Mr. Sarvadi’s substantial financial stake in the Company creates a strong alignment of interests with other stockholders. Mr. Sarvadi’s combined roles also ensure that a unified message is conveyed to stockholders, employees and clients.
The position of lead independent director is established by our Corporate Governance Guidelines. Mr. YoungClifford is currently the lead independent director. The Board reevaluates the lead independent director position annually. The lead independent director has the following responsibilities in addition to the regular duties of a director:
•prepare and set the agenda for and chair executive sessions of the outside directors;
•preside at all meetings of the Board where the Chairman of the Board is not present or has a potential conflict of interest;
•serve as liaison and facilitate communications between the independent directors and the Chairman of the Board and CEO;
•consult with the Chairman of the Board and CEO on matters relating to corporate governance and performance of the Board; and
•collaborate with the Finance, Risk Management and Audit Committee and with the rest of the Nominating and Corporate Governance Committee on possible director conflicts of interest or breaches of the Corporate Governance Guidelines.
Board of Directors’ Role in Risk Oversight
The Board is responsible for overseeing the Company’s overall risk profile and assisting management in addressing specific risks. Our Enterprise Risk Management Steering Committee (the “ERM Steering Committee”) is responsible for formally identifying and evaluating risks that may affect our ability to execute our corporate strategy and fulfill our business objectives. The ERM Steering Committee employs a disciplined approach to identifying, documenting, evaluating, communicating, and monitoring enterprise risk management within the Company. The ERM Steering Committee is chaired by the Company’s chief financial officer and includes the Company’s general counsel, internal audit director and other members of management. The ERM Steering Committee reports to the Board and the CEO. The ERM Steering Committee is charged with periodically reviewing our overall risk profile, as well as any significant identified risks, with both the Finance, Risk Management and Audit Committee and the entire Board.
During 2018,2020, the ERM Steering Committee completed a comprehensive review and update of the Company’s risks, including strategic, operational, financial, legal, regulatory and reputational risks. The ERM Steering Committee further reviewed and updated the mitigating factors associated with such risks, and prioritized the identified risks based upon the subjectively determined likelihood of the occurrence and the estimated resulting impact on the Company if the risk occurred.
The Board executes its risk oversight function both directly and through its standing committees, each of which assists the Board in overseeing a part of the Company’s overall risk management. Throughout the year, the Board and each such committee spend a portion of their time reviewing and discussing specific risk factors, and risk assessments are part of all major decision making. The Board is kept informed of each committee’s risk oversight and related activities
| Insperity | 13 | 2021 Proxy Statement | ||||||
through regular reports from such committees. The Finance, Risk Management and Audit Committee is assigned primary responsibility for oversight of risk assessment with financial implications.implications, including those that threaten the long-term sustainability of our business. In its periodic meetings with management, internal auditors and independent auditors, the Finance, Risk Management and Audit Committee reviews and monitors many factors relating to enterprise risk, including:
•the financial affairs of the Company;
•the Company’s compliance with legal and regulatory requirements;
•the independent auditor’s qualifications, independence and performance;
•the performance of the personnel responsible for the Company’s internal audit function and independent auditors; and
•the Company’s policies and procedures with respect to risk management.
The Compensation Committee has the primary responsibility to consider material risk factors relating to the Company’s compensation policies and practices. The Nominating and Corporate Governance Committee monitors governance and succession risks. As part of its review and approval of our capital budget, major acquisitions, material contracts, compensation and other similar matters, the Board retains ultimate authority over assessing the risks and their impacts on our business.
Prohibition on Hedging and Pledging of Our Common Stock
We have established strict standards regarding the speculative trading of our common stock. We prohibit employees and directors from engaging in hedging transactions involving our common stock. The Board also adopted a formal policy prohibiting employees and directors from engaging in the significant pledging of shares of our common stock. All pledgingAny requests will beto pledge shares or to increase existing amounts of pledged shares are reviewed by the Board, which will considerconsiders the facts and circumstances and other information the Board deems relevant.
As of April 2, 2019,5, 2021, Mr. Sarvadi had 120,000140,000 shares of our common stock pledged, which represents a reductionrepresented approximately 8.3% of 80,000the shares pledged, or a 40% decrease, as compared to April 2018.of our common stock Mr. Sarvadi beneficially owned. After a thorough review, the Board previously determinedapproved Mr. Sarvadi’s pledge of shares based on their determination that the number of shares pledged by him were not significant. In making this determination, the Board considered that the pledged shares did not represent a material portion of the total shares beneficially owned by him, andwere less than 1% of our total shares outstanding and market capitalization. The pledged shares represent approximately 6.3%capitalization, and also represented an amount that could reasonably be expected to be sold in an orderly manner in a short period of time given the shares of our common stock Mr. Sarvadi beneficially owned as of April 2, 2019.Company’s historic average daily trading volume. The Board also considered Mr. Sarvadi’s significant number of founder’s shares that were not earned as compensation from the Company, and his compliance with our stock ownership guidelines disregarding(disregarding the pledged shares), and the purpose of his pledge being unrelated to an attempt to shift or hedge economic risk in owning Company shares.
Code of Business Conduct and Ethics
The Board has adopted a Code of Business Conduct and Ethics (the “Code”) governing the conduct of our directors, officers and employees. The Code, which meets the requirements of Rule 303A.10 of the NYSE Listed Company Manual and Item 406 of Regulation S-K, is intended to promote honest and ethical conduct,conduct; full, fair, accurate, timely and understandable disclosure in our public filings,filings; compliance with lawslaws; and the prompt internal reporting of violations of the Code. Our new employees are required to certify that they have reviewed and understand the Code. In addition, our annual compliance training for all employees reminds them of their obligations under the Code and provides practical examples to foster a deeper understanding of its principles. You can access the Code on our website at www.insperity.com inunder the Corporate Governance section underheading in the Investor Relations tab.section. The Finance, Risk Management and Audit Committee has responsibility for oversight of compliance with Code. Changes in and waivers to the Code for our directors, executive officers and certain senior financial officers will be posted on our Internet website within four business days of being approved and will be maintained for at least 12 months. If you wish to raise a question or concern or report a violation, including anonymously, to the Finance, Risk Management and Audit Committee, you should visit www.ethicspoint.com or call the Ethicspoint toll-free hotline at 1-866-384-4277.
| Insperity | 14 | 2021 Proxy Statement | ||||||
Stockholder Communications
Stockholders and other interested parties may communicate directly with the entire Board or the non-management directors as a group by sending an email to directors@insperity.com. Alternatively, you may mail your correspondence to the Board or non-management directors in care of the Corporate Secretary, 19001 Crescent Springs Drive, Kingwood, Texas 77339. In the subject line of the email or on the envelope, please specify whether the communication is addressed to the entire Board or to the non-management directors.
Unless any director directs otherwise, communications received (via U.S. mail or email) will be reviewed by our Corporate Secretary who will exercise his discretion not to forward to the Board correspondence that is inappropriate such as business solicitations, frivolous communications and advertising, routine business matters (i.e., business inquiries, complaints, or suggestions), and personal grievances.
MEETINGS AND COMMITTEES OF THE BOARD OF DIRECTORS
The Board of Directors
Directors are expected to attend all or substantially all Board meetings and meetings of the Committees of the Board on which they serve. Directors are also expected to spend the necessary time to discharge their responsibilities appropriately (including advance review of meeting materials) and to ensure that other existing or future commitments do not materially interfere with their responsibilities as members of the Board. The Board met sevennine times in 2018. All2020. During 2020, all of the members of the Board participated in more thanat least 75% of the meetings of the Board and Committees of which they were members during the fiscal year ended December 31, 2018.period of such director’s service. The Board encourages its members to attend the Annual Meeting of Stockholders. Last year, eightnine of our directors attended the Annual Meeting of Stockholders.
Executive Sessions of the Board of Directors and the Lead Independent or Presiding Director
Our outside directors hold executive sessions at which our management is not in attendance at regularly scheduled Board meetings, and our independent directors hold executive sessions at which our management is notonly the independent directors are in attendance at least once per year. The lead independent director establishes the agenda and serves as presiding director
at the executive sessions. In the absence of a lead independent director, the chairperson of the Nominating and Corporate Governance Committee (if different from the lead independent director) or an independent director designated by the outside directors will preside at meetings of non-management directors. Currently, Mr. YoungClifford serves as the lead independent director and Ms. Kaufman serves as the chairperson of the Nominating and Corporate Governance Committee.
Committees of the Board of Directors
The Board has appointed three standing committees: the Finance, Risk Management and Audit Committee; the Compensation Committee; and the Nominating and Corporate Governance Committee. The charters for each of the three standing Committees, which have been adopted by the Board, contain a detailed description of the respective standing committee’s duties and responsibilities and are available on our website at www.insperity.com inunder the Corporate Governance section underheading in the Investor Relations tab.section. The Board has reviewed the applicable legal and NYSE standards for independence for members of each of the Finance, Risk Management and Audit Committee; the Compensation Committee; and the Nominating and Corporate Governance Committee, as well as our independence standards for such Committees, and has determined that the members of each of those Committees of the Board is “independent” under such requirements.
Nominating and Corporate Governance Committee
The Nominating and Corporate Governance Committee met fivefour times in 2018.2020. The members of the Nominating and Corporate Governance Committee currently are Ms. Kaufman, who serves as chairperson Mr. Clifford and Mr. Young.Clifford. The Nominating and Corporate Governance Committee: (1) identifies individuals qualified to become Board members, consistent with the criteria for selection approved by the Board; (2) recommends to the Board a slate of director nominees to be elected by the stockholders at the next Annual Meeting of Stockholders and, when appropriate, director appointees to take office between Annual Meetings of Stockholders; (3) develops and recommends to the Board a set of corporate governance guidelines for the Company; and (4) oversees the evaluation of the Board.
| Insperity | 15 | 2021 Proxy Statement | ||||||
Finance, Risk Management and Audit Committee
The Finance, Risk Management and Audit Committee met eight times in 2018.2020. The members of the Finance, Risk Management and Audit Committee currently are Mr. Young,Ms. Masterson, who serves as chairperson, Ms. MastersonMr. Lumelleau, Mr. Morphy and Mr. Morphy.Dr. Ramchand. The Board has determined that Mr. Youngeach member of the Finance, Risk Management and Audit Committee is an “audit committee financial expert” as such term is defined in Item 401(h) of Regulation S-K promulgated by the SEC. The Finance, Risk Management and Audit Committee assists the Board in fulfilling its responsibility to oversee the financial affairs, risk management, accounting and financial reporting processes, and audits of financial statements of the Company by reviewing and monitoring: (1) the financial affairs of the Company; (2) the integrity of the Company’s financial statements and internal controls; (3) the Company’s compliance with legal and regulatory requirements; (4) the independent auditor’s qualifications, independence and performance; (5) the performance of the personnel responsible for our internal audit function and the independent auditors; and (6) our policies and procedures with respect to risk management, as well as other matters that may come before it as directed by the Board.
Compensation Committee
The Compensation Committee met fivenine times in 2018.2020. The members of the Compensation Committee currently are Mr. Clifford, who serves as chairperson, Dr. Jones, Ms. Kaufman and Mr. Mehl. The Compensation Committee: (1) oversees and administers the Company’s compensation policies, plans and practices; (2) reviews and discusses with management the Compensation Discussion and Analysis required by the rules of the SEC; and (3) prepares the annual report required by the rules of the SEC on executive compensation for inclusion in the Company’s annual report on Form 10-K or proxy statement for the Annual Meeting of Stockholders. To carry out these purposes, the Compensation Committee: (1) evaluates the performance of, and determines the compensation for, our senior management,the CEO and, taking into consideration recommendations made by the CEO;CEO, our other executive officers; (2) administers our compensation programs; and (3) performs such other duties as may from time to time be directed by the Board.
Pursuant to the terms of the Insperity, Inc. 2001 Incentive Plan, as amended (the “2001 Incentive Plan”), and the Insperity, Inc. 2012 Incentive Plan, as amended (the “2012 Incentive Plan” and, together with the 2001 Incentive Plan, the “Incentive Plans”), the Board or the Compensation Committee may delegate authority under the Incentive Plans to the Chairman of the Board or a committee of one or more Board members, respectively, pursuant to such conditions and limitations as each may establish, except that neither may delegate to any person the authority to make awards, or take other action, under the Incentive Plans with respect to participants who may be subject to Section 16 of the Securities Exchange Act of 1934, as amended (the “Exchange Act”).
EXECUTIVE COMPENSATION
Compensation Discussion and Analysis
This Compensation Discussion and Analysis (“CD&A”) explains our compensation philosophy, objectives, and strategies and the underlying elements of our compensation programs for our named executive officers (“NEOs”). in 2020. This CD&A also summarizes decisions that the Compensation Committee of our Board (“Compensation Committee”) made regarding these programs and the factors considered in making those decisions. The following individuals comprised our NEOs for 2018:
2020:
| Name | Title | |||||
| Paul J. Sarvadi | Chief Executive Officer and Chairman of the Board | |||||
| Douglas S. Sharp | Chief Financial Officer, Senior Vice President of Finance and Treasurer | |||||
| A. Steve Arizpe | President and Chief Operating Officer | |||||
Jay E. Mincks | 1 | Executive Vice President of Sales and Marketing | ||||
| Daniel D. Herink | Senior Vice President of Legal, General Counsel and Secretary | |||||
_________________________
1As previously announced, Mr. Mincks voluntarily resigned his officer position effective March 31, 2021, and will continue as a special advisor to the CEO until Mr. Mincks’s retirement on September 1, 2021. Please see our Form 8-K filed on February 26, 2021 for additional information.
Insperity | 16 | 2021 Proxy Statement | |||||||
Key Decisions and Events Influencing Executive Compensation in 2020
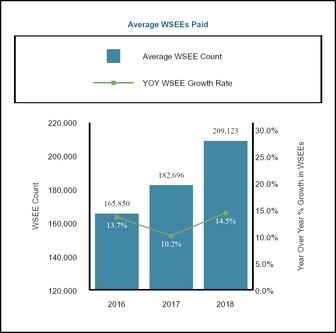
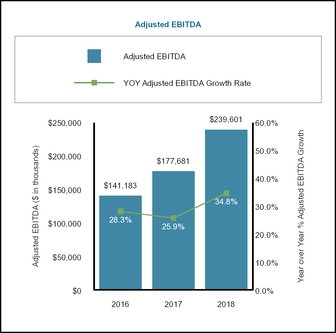
Due largely to the impact of Contentsthe COVID-19 pandemic, 2020 was challenging for Insperity and the clients we serve. The year began with a renewed focus on achieving both double-digit worksite employee and earnings growth. Although the Company achieved double-digit growth in average number of paid worksite employees (“WSEEs”) in 2019, growth was lower than originally budgeted and was decelerating as the Company headed into 2020. Additionally, after achieving double-digit growth in profitability (as measured by adjusted EBITDA) each year from 2015-2018, the growth in our profitability slowed to 4.3% in 2019.
•Incented and rewarded the executives for increasing growth rates by tying one-hundred percent of the Short-Term Incentive Program payout opportunity to growth in WSEEs and profitability,
•Set aggressive targets for the payouts, and
•Changed the corporate component from a purely cash award to a combination of cash and performance-based stock awards.
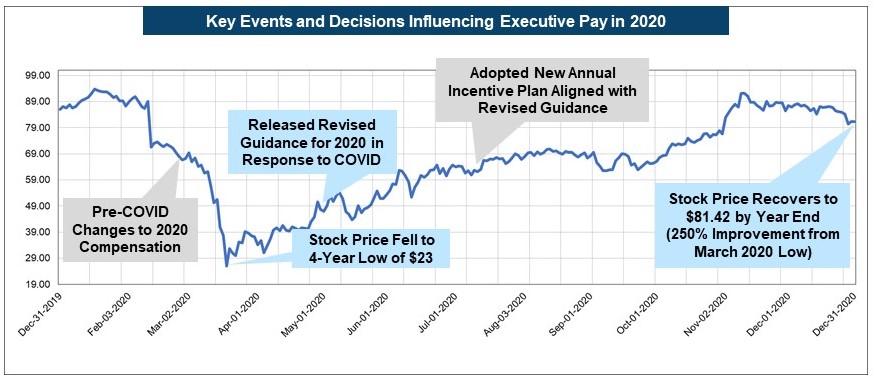
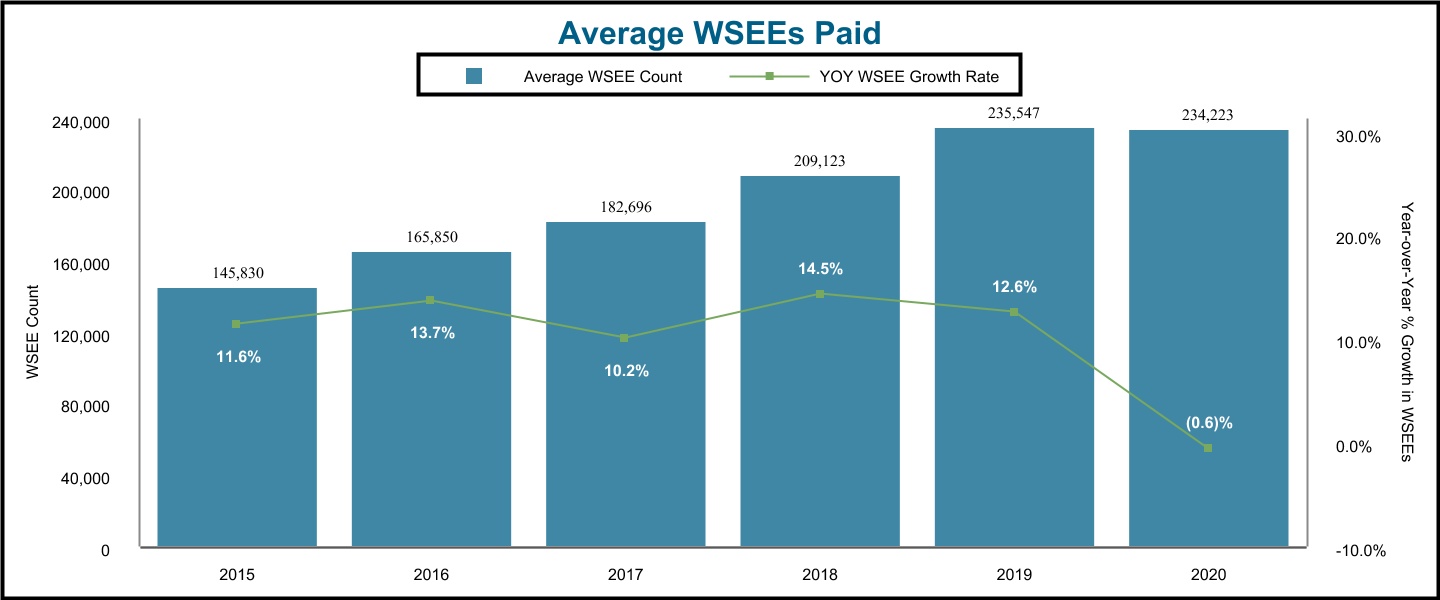
Shortly after the adoption of the restructured Short-Term Incentive Program, the onset of COVID-19 began to have a material impact on the businesses of many of our clients. Small and medium sized businesses, the core of the Company’s client base, were significantly impacted as many states and municipalities in the United States issued orders mandating the temporary closure or capacity restrictions of businesses in response to the COVID-19 pandemic. The disruption with our client base was severe and impactful with some clients terminating, furloughing or temporarily laying-off employees, and in some cases going out of business permanently. The impact of COVID-19 on our clients also adversely impacted our business. During the April through May time period alone, the Company suffered a greater than 6% sequential reduction in the overall number of WSEEs paid and, as a result, we released revised full year 2020 guidance in May that projected up to a 6% year-over-year decline in the average number of WSEEs paid and a decrease of up to 14% in year-over-year adjusted EBITDA.
Due to the unexpected pandemic and its impact on the economy, the Compensation Committee concluded that the growth targets set in February 2020 had become unachievable and believed it was critical to establish a new program that aligned with the evolving priorities of the Company and helped position the Company for a recovery. In response to the market environment after the onset of COVID-19, the Compensation Committee evaluated the Short-Term Incentive Program with input from outside advisers and adopted a new annual incentive plan that aligned the workforce with achieving results in line with our revised guidance and executing on other key COVID-related strategic objectives. The revised Short-Term Incentive Program supported the Company’s strong execution and by year end:
•The average number of WSEEs paid returned to the March 2020 level,
•We obtained record profitability, and
•Our stock price rebounded to pre-pandemic levels.
| 2021 Proxy Statement | ||||||||
Incentive Plans Supported Strong Execution in Challenging Environment
COVID-19 Response Highlights
With the onset of the COVID-19 pandemic, significant Company resources were focused on providing timely and effective support of our clients and employees. This focus was not only important to the financial viability of our clients, it was critical to our Company’s financial success. Within the first week following passage of the Families First Coronavirus Response Act (“FFCRA”) in March 2020, the Company established a cross-functional team of Company leaders to support our sales and service teams in rapidly meeting our clients’ needs and requests.
As the nationwide effects of the COVID-19 pandemic waged on, the impact of management’s swift response to additional COVID-19 relief legislation and regulatory guidance was critical to our clients’ human resource and financial needs, and ultimately the highly-valued services we delivered to our clients during this challenging time. Our clients and WSEEs directly benefited from the Company’s efforts by obtaining FFCRA sick and family leave credits, employee retention and client FICA deferral credits, and Paycheck Protection Program (“PPP”) loans and PPP loan forgiveness reports. Our clients also received support from the Company’s dedicated teams and educational and training efforts in connection with all areas of their employment practices. We believe that our efforts to support our clients were directly tied to our clients’ sustainability and the recovery in our average WSEEs paid to pre-pandemic levels. These management led efforts culminated in record profitability for the Company and significantly improved growth numbers from the beginning of the COVID-19 pandemic. Please see “— 2020 Performance Results — COVID-19 Response Performance” later in this CD&A for highlights of the support we provided to our clients and employees.
Financial Highlights
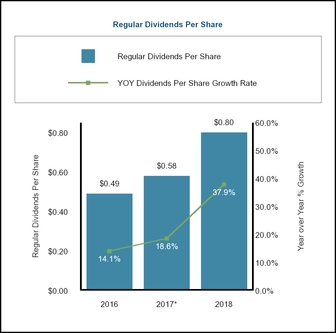
The strong execution of our leadership team and employees following the onset of COVID-19 allowed us to recover our number of WSEEs paid to pre-pandemic levels and achieve record profitability in 2020 with our adjusted EBITDA of $288.6 million, representing a 15.4% increase compared to 2019. We believe that this performance contributed to the increase in our stock price of over 250% from our March 2020 low of $23 and allowed us to pay record annual dividends of $1.60 per share and repurchase 1.4 million shares of our stock.
| 18 | 2021 Proxy Statement | |||||||
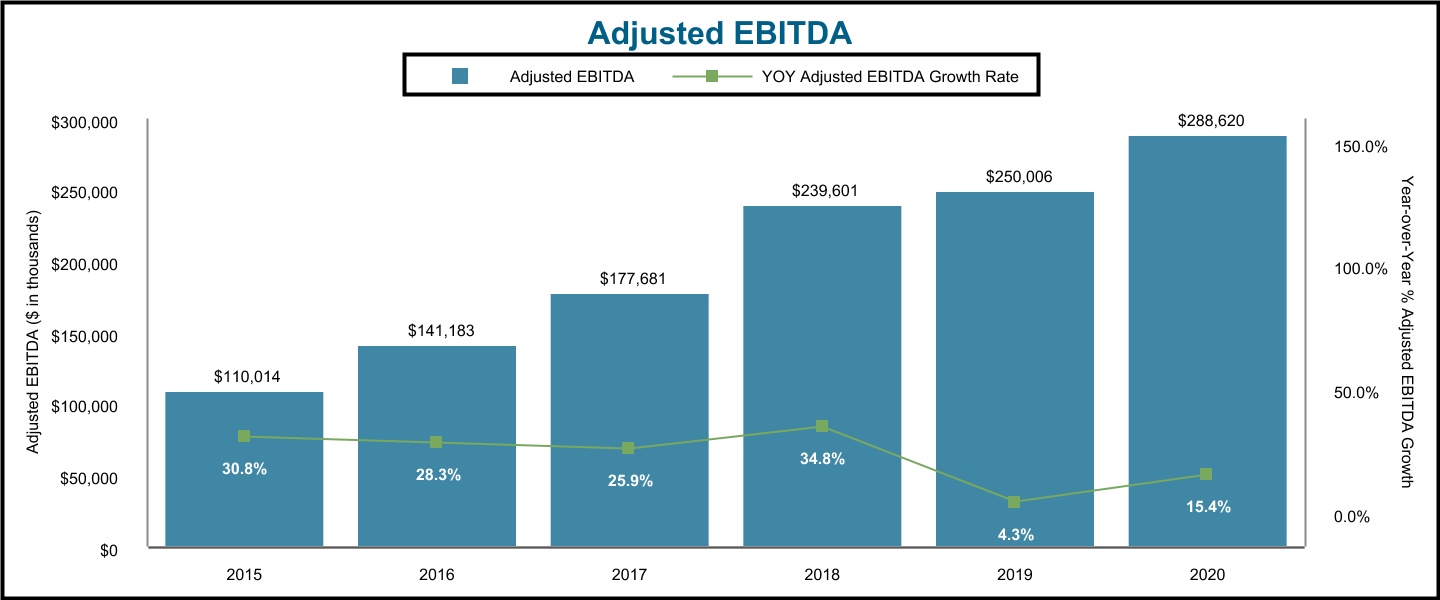
Note: Adjusted EBITDA is a non-GAAP financial measure used by management to analyze the Company’s performance. Adjusted EBITDA represents EBITDA (earnings before interest, taxes, depreciation and amortization) plus stockholder advisory expenses, tax reform bonuses, and stock-based compensation. Please read Item 7, “Management’s Discussion and Analysis of Financial Condition and Results of Operations—Non-GAAP Financial Measures,” in our annual report on Form 10-K for the year ended December 31, 2020 filed with the SEC on February 11, 2021 for a reconciliation of this non-GAAP financial measure to the most directly comparable financial measure calculated and presented in accordance with GAAP.
| Insperity | 19 | 2021 Proxy Statement | ||||||
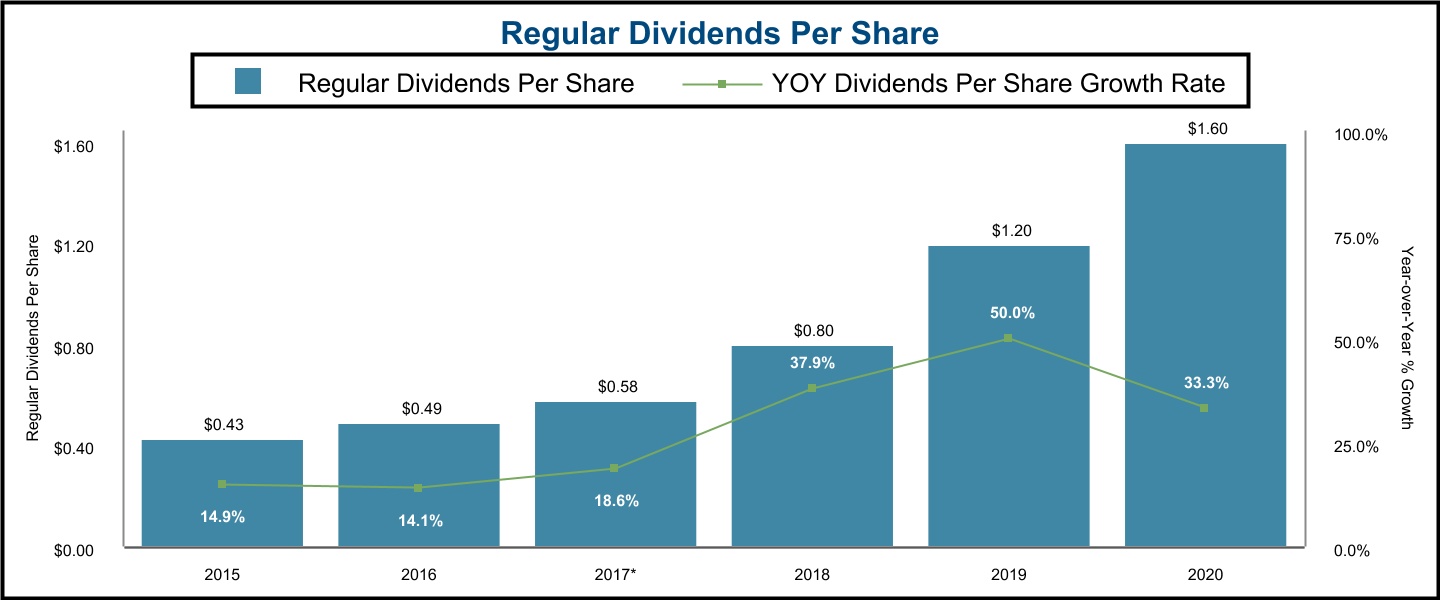
*Excludes a special dividend of $1.00 per share paid in the fourth quarter of 2017.